Manchester United's billion-pound misfire: What every CFO must learn
April 3, 2025
When Sir Alex Ferguson lifted Manchester United's 20th league title in 2013, few could have imagined that a decade later the club would still be waiting for number 21. In the ten years since that triumph, United have spent eye-watering sums on players and managers in an effort to reclaim former glories, yet the Premier League trophy cabinet has remained shut. Under the ownership of the Glazer family, the club has witnessed record revenues and spending, but also persistent debt, multiple managerial sackings, and even shareholder dividends, all with relatively little to celebrate on the pitch. It's been a decade defined by big money and even bigger questions for England's most storied club.
A Decade By the Numbers (2013-2023):
- Transfer Spending: ~£1.4 billion (highest in world football)
- Net Debt: Nearly £1 billion (incurring ~£35m in annual interest)
- Wage Bill: Record £384 million in 2022 (highest ever in Premier League)
- Managerial Payouts: ~£75 million in compensation to sacked managers
- Dividends to Owners: £150+ million (Manchester United is the only PL club to pay dividends)
- Premier League Titles: 0
These figures tell a story of a club that hasn't been shy about spending or generating income. In the sections below, we take a closer look at each aspect from booming revenues and ballooning debt to skyrocketing salaries, the costly churn of managers, and controversial dividend payments.
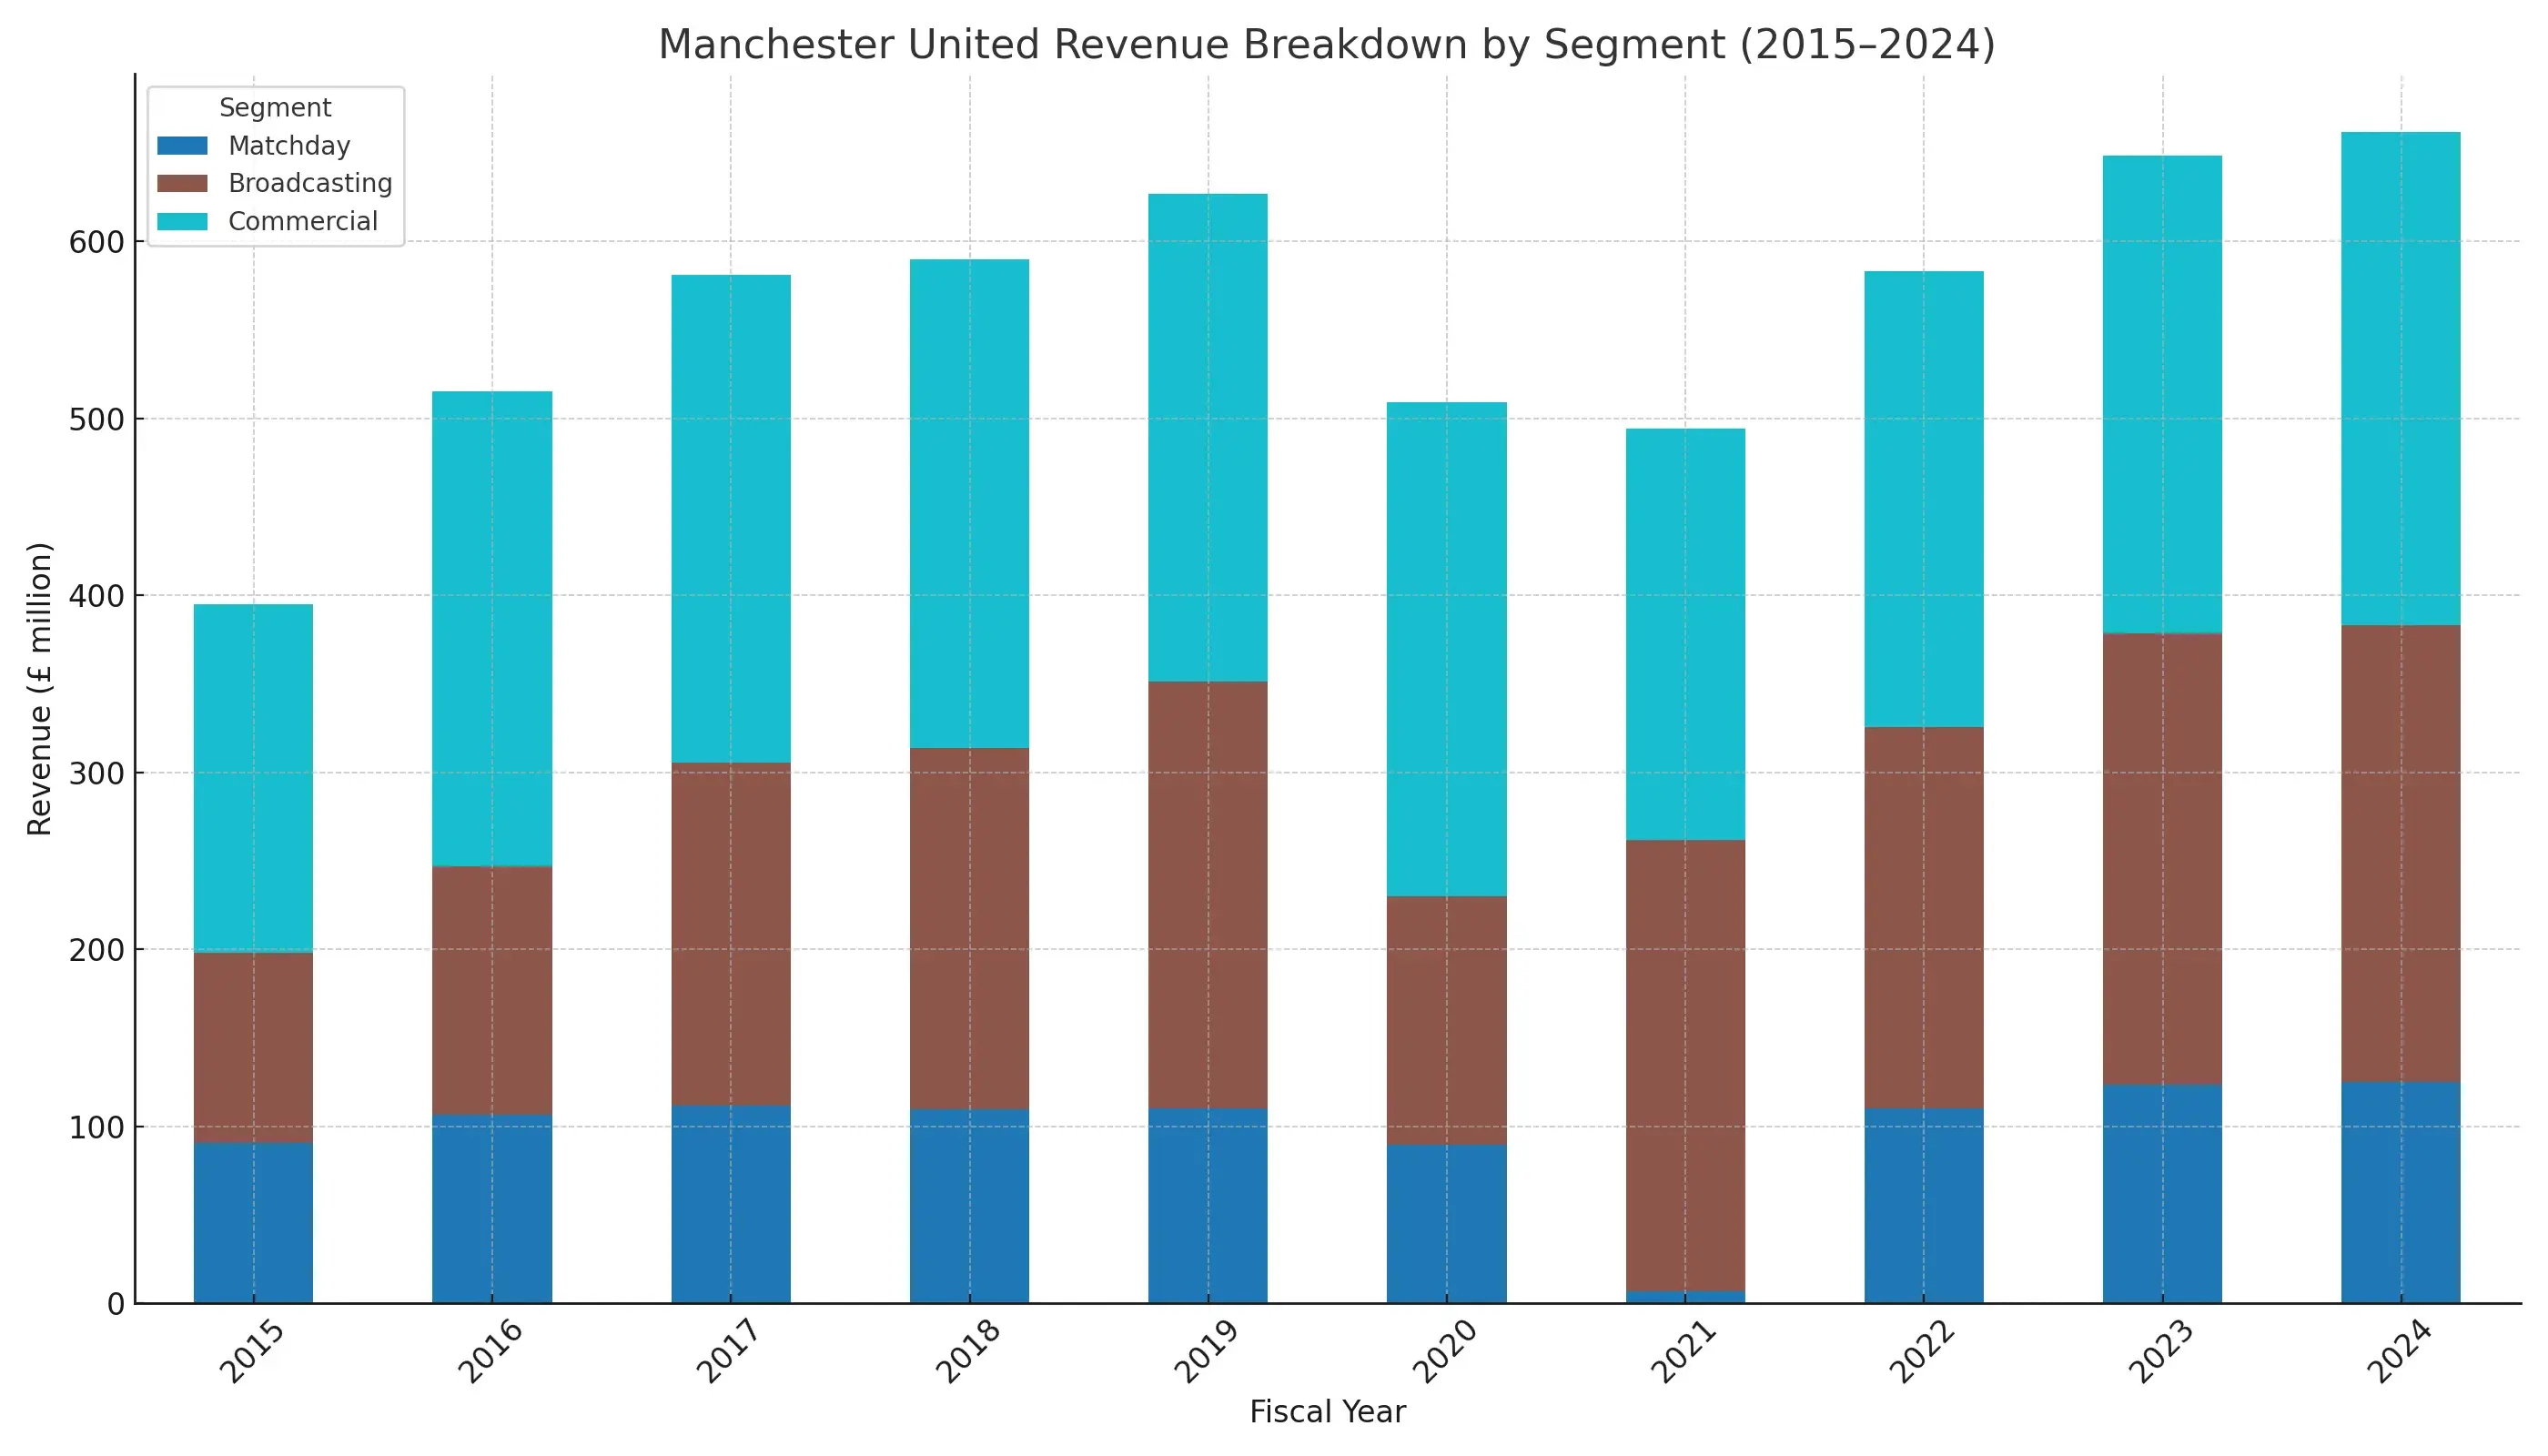
1. Total Revenue: A Tale of Resilience and Recovery
Manchester United's revenue rose from £395.2m in 2015 to £661.8m in 2024 a 67.5% increase over the decade. That might seem like an obvious win, but the story behind the numbers is more nuanced.
Broadcasting Revenue Breakdown
United's broadcasting income has become an increasingly vital revenue stream, but it's also the most volatile. European qualification plays a massive role in boosting or depressing this number.
| Year | Domestic Competitions (£m) | European Competitions (£m) |
|---|---|---|
| 2017 | 145.6 | 39.5 |
| 2018 | 155.1 | 38.3 |
| 2019 | 148.0 | 83.1 |
| 2020 | 115.4 | 16.8 |
| 2021 | 174.7 | 73.8 |
| 2022 | 140.6 | 67.5 |
| 2023 | 174.5 | 28.5 |
| 2024 | 161.7 | 53.8 |
Why It Matters
- The difference between Europa League and Champions League qualification can swing broadcasting revenue by £40-£80 million.
- In 2020 and 2022, the dip in European performance or non-qualification slashed income dramatically.
- Falling out of Europe altogether could cost United £80m+ in lost revenue.
Fan Insight: The stakes aren't just about trophies, they're about TV money. Every limp cup exit or missed top-4 finish isn't just disappointing; it's financially disastrous.
| Fiscal Year | Total Revenue (£m) | Matchday Revenue (£m) | Broadcasting Revenue (£m) | Commercial Revenue (£m) |
|---|---|---|---|---|
| 2015 | 395.2 | 90.6 | 107.7 | 196.9 |
| 2016 | 515.3 | 106.6 | 140.4 | 268.3 |
| 2017 | 581.2 | 111.6 | 194.1 | 275.5 |
| 2018 | 589.8 | 109.8 | 204.1 | 275.9 |
| 2019 | 627.1 | 110.0 | 241.2 | 275.9 |
| 2020 | 509.0 | 89.8 | 140.2 | 279.0 |
| 2021 | 494.1 | 7.1 | 254.8 | 232.2 |
| 2022 | 583.2 | 110.5 | 214.9 | 257.8 |
| 2023 | 648.4 | 123.7 | 254.8 | 269.9 |
| 2024 | 661.8 | 125.2 | 257.8 | 278.8 |
| Year | Matchday (%) | Broadcasting (%) | Commercial (%) |
|---|---|---|---|
| 2015 | 22.9% | 27.2% | 49.8% |
| 2017 | 19.2% | 33.4% | 47.4% |
| 2020 | 17.6% | 27.6% | 54.8% |
| 2021 | 1.4% | 51.6% | 47.0% |
| 2024 | 18.9% | 39.0% | 42.1% |
Key Takeaways:
- Growth across all fronts, peaking at £627.1m in 2019.
- COVID-19 impact: Matchday revenue crashes to £7.1m in 2021.
- Recovery and new highs: Matchday hits £125.2m, total revenue at all-time high.
- Commercial revenue, once 50%+ of total, now makes up ~42% in 2024, while broadcasting has become more prominent.
2A. Player Salaries: Premium Payroll, Patchy Performance
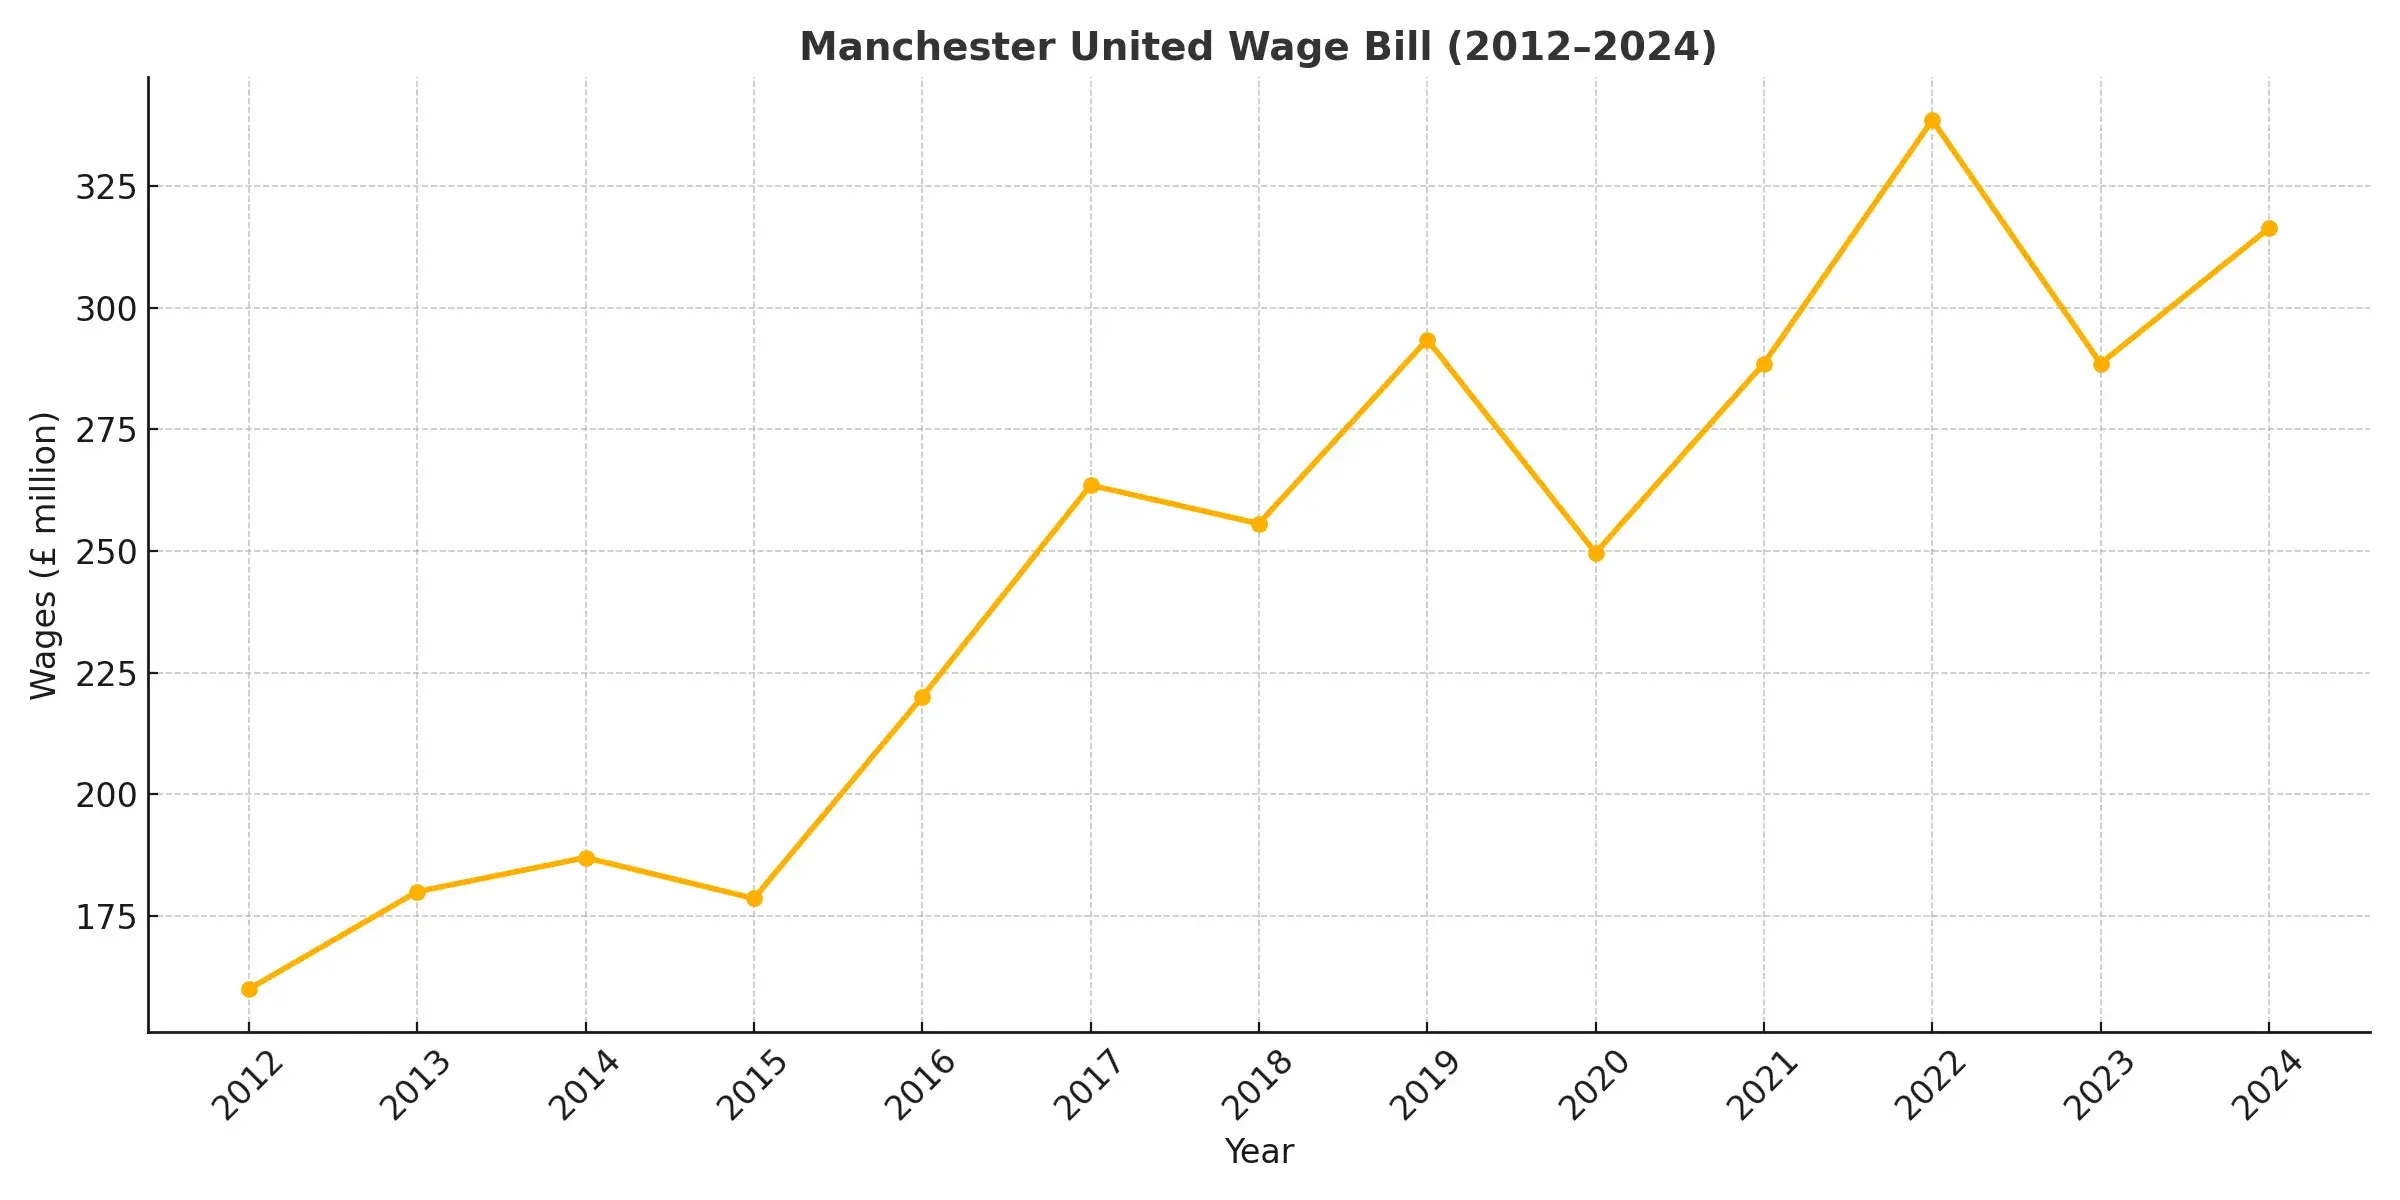
If transfer fees grab headlines, United's wage bill is the silent giant of their expenses. Over the last ten years, salaries at Old Trafford have skyrocketed. In fact, by 2022, Manchester United's annual wage bill hit £384 million, setting a Premier League record. From marquee signings like Cristiano Ronaldo, whose return came with a hefty weekly wage to substantial contracts for players like Paul Pogba and Alexis Sanchez, United have consistently spent like champions but played like nearly-men. The payroll doesn't reflect coherent squad building. High wages + underperformance = one of the worst value ratios in football.
Such lavish salaries might be easier to justify if they delivered commensurate success, but United's on-pitch results in the league have largely failed to match the investment. The club's wage-to-performance ratio has been a point of concern; high player payrolls contributed to Financial Fair Play pressures and forced the club to consider measures like a wage cap (the Ronaldo rule) to prevent the structure from spiraling further. The chart below shows the steep climb in United's staff costs, highlighting a critical question: has the enormous wage outlay actually improved the team's fortunes.
Fan Insight: Loyalty has limits. If you're charging top dollar at the gate and on jerseys, fans deserve more than sixth-place finishes.
2B. Wages, Staff Size & A Culture of Costly Underperformance
The real financial drain isn't just big-name flops, it's the overall scale of the wage bill. Manchester United has maintained one of the largest payrolls in Europe, but the return on investment? Let's just say it hasn't matched the bill.
Wages and Salaries Breakdown (2012-2024)
| Year | Wages and Salaries (£'000) |
|---|---|
| 2012 | 160,000 |
| 2013 | 180,000 |
| 2014 | 187,000 |
| 2015 | 178,637 |
| 2016 | 220,000 |
| 2017 | 263,500 |
| 2018 | 255,637 |
| 2019 | 293,424 |
| 2020 | 249,564 |
| 2021 | 288,451 |
| 2022 | 338,503 |
| 2023 | 288,451 |
| 2024 | 316,341 |
Staff Numbers by Role (2012-2024)
Key departments including coaching, commercial, and admin have grown significantly without equivalent results on the pitch.
| Year | Players | Coaches | Commercial | Media | Admin/Other | Total FT Staff |
|---|---|---|---|---|---|---|
| 2012 | 79 | 80 | 76 | 73 | 388 | 696 |
| 2013 | 82 | 76 | 125 | 69 | 391 | 743 |
| 2014 | 79 | 92 | 138 | 91 | 469 | 869 |
| 2015 | 73 | 89 | 122 | 89 | 440 | 813 |
| 2016 | 80 | 96 | 130 | 85 | 452 | 843 |
| 2017 | 74 | 136 | 120 | 84 | 445 | 865 |
| 2018 | 81 | 115 | 121 | 87 | 466 | 870 |
| 2019 | 104 | 163 | 114 | 85 | 474 | 940 |
| 2020 | 115 | 176 | 129 | 88 | 484 | 992 |
| 2021 | 118 | 176 | 131 | 90 | 468 | 983 |
| 2022 | 124 | 193 | 151 | 94 | 477 | 1,035 |
| 2023 | 131 | 192 | 160 | 104 | 525 | 1,112 |
| 2024 | 136 | 193 | 170 | 110 | 530 | 1,140 |
What This Tells Us:
- Between 2012 and 2024, United increased its full-time workforce by 64%, growing from 696 to 1,140 staff.
- Most of the expansion came in coaching, commercial, and admin departments, but without a proportionate return in either footballing success or revenue.
- Player wages more than doubled from £142.7 million in 2012 to £316.3 million in 2024, even as on-pitch results stagnated.
- The wage-to-performance ratio is one of the worst among elite clubs, showing a disconnect between cost and output.
Fan Insight: United aren't just losing on the pitch, they're leaking money off it. A bloated staff structure and superstar salaries without silverware isn't ambition. It's inefficiency at scale.
2C. Executive Pay: Big Wages at the Top
Beyond the bloated player payrolls, Manchester United's senior executives have also earned handsomely, regardless of the club's financial or footballing performance.
Key Management Compensation (Short-Term Employee Benefits)
| Year | Short-Term Benefits (£'000) |
|---|---|
| 2012 | 8,221 |
| 2013 | 8,480 |
| 2014 | 9,216 |
| 2015 | 8,826 |
| 2016 | 9,652 |
| 2017 | 10,500 |
| 2018 | 9,942 |
| 2019 | 9,961 |
| 2020 | 9,507 |
| 2021 | 8,326 |
| 2022 | 9,200 |
| 2023 | 9,850 |
| 2024 | 10,110 |
Insight:
- These figures cover a handful of top directors, yet amount to nearly £100 million over a decade.
- Compensation remained high even during trophyless and financially turbulent seasons.
- For fans and analysts, this raises a pointed question: Should boardroom rewards really be insulated from on-pitch results and balance sheet performance?
2D. Wage Efficiency: Are United Overpaying for Mediocrity
One of the clearest ways to evaluate a club's financial efficiency is to compare wage spend vs league performance. This chart shows how much top clubs spent per Premier League point in the 2022/23 season.
Wage Spend per Premier League Point (2022/23)
| Club | Estimated Wage Spend (£m) | League Points | per Point |
|---|---|---|---|
| Man United | 338.5 | 75 | £4.51m |
| Brighton | 115.0 | 62 | £1.85m |
| Brentford | 94.0 | 59 | £1.59m |
| Arsenal | 244.0 | 84 | £2.90m |
| Man City | 360.0 | 89 | £4.04m |
Data Sources: Official 20-F filings, Capology.com, Deloitte Money League, club disclosures. League points from Premier League table.
Methodology:
Wage Spend per Point = First-Team Wages League Points
Only includes player + first-team staff wages, excluding exec and academy.
What It Reveals:
- United paid £4.51m per point in 2022/23 more than Arsenal, Brighton, and Brentford combined.
- Brentford got over 2.8x better return per £ than United.
- Even Man City, with a bigger wage bill, earned better value per point.
Historical View: Man United's Wage Cost per League Point (2012-2024)
| Year | Wages (£m) | League Points | per Point |
|---|---|---|---|
| 2012 | 160.0 | 89 | £1.80m |
| 2013 | 180.0 | 86 | £2.09m |
| 2014 | 187.0 | 64 | £2.92m |
| 2015 | 178.6 | 70 | £2.55m |
| 2016 | 220.0 | 66 | £3.33m |
| 2017 | 263.5 | 69 | £3.82m |
| 2018 | 255.6 | 81 | £3.16m |
| 2019 | 293.4 | 66 | £4.44m |
| 2020 | 249.6 | 66 | £3.78m |
| 2021 | 288.5 | 74 | £3.90m |
| 2022 | 338.5 | 58 | £5.84m |
| 2023 | 288.5 | 75 | £3.85m |
| 2024 | 316.3 | 78 | £4.05m |
Perspective:
In Sir Alex Ferguson's final season (2012), United won the league spending £1.80m per point. By 2022, that ballooned to £5.84m during one of their worst modern campaigns.
Fan Takeaway: You can't fix the on-pitch product if the business model rewards underachievement. High wages are fine, if they produce high results. At United, that hasn't been the case.
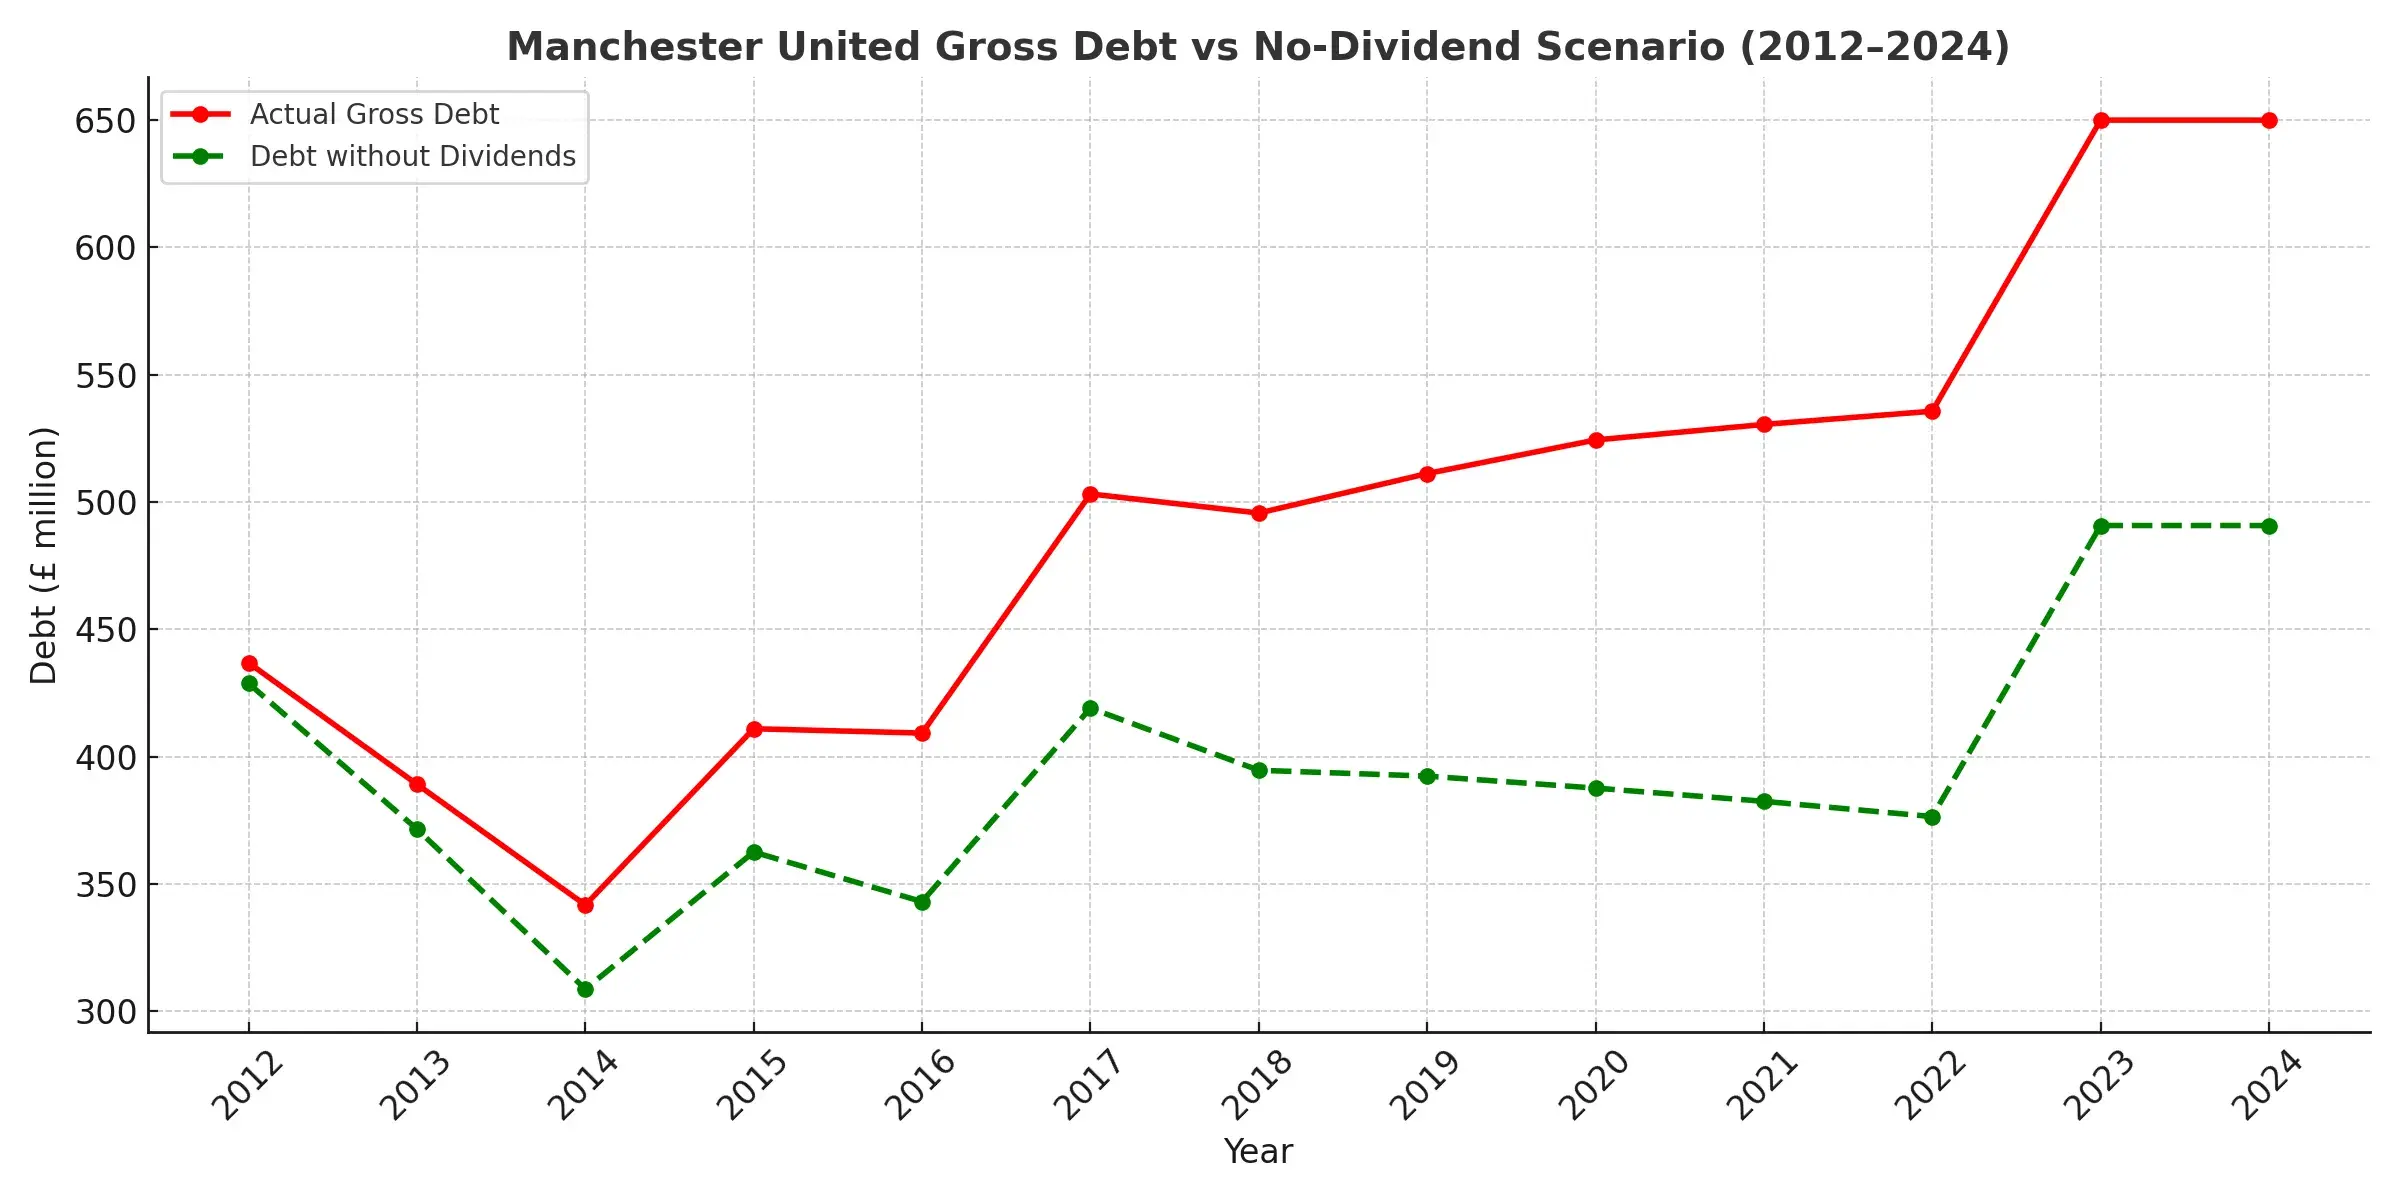
3. Debt Levels: A Shadow That Never Leaves
One of the most contentious aspects of Manchester United's finances remains the club's debt. The Glazer family's 2005 leveraged buyout saddled United with a massive debt burden, and a decade on from Ferguson's retirement that burden is still there and arguably heavier. The club's gross debt hovers around £750 million (often cited as nearly £1 billion, when including bank loans and other liabilities). This debt has hardly budged even as revenues grew, because United has had to continually service it rather than pay it down.
The cost of carrying this debt has been enormous. United have spent tens of millions annually on interest payments (about £35 million in the most recent year alone) instead of on new players or stadium improvements. Over the past decade, the cumulative interest outlay has approached the cost of an elite player transfer. Fans often point out that this financial millstone has limited the club's ability to compete, especially when combined with the high spending elsewhere. The debt remains a big question mark! why a club generating so much money cannot shake off the loans that have hung over it for so long.
Thanks to the 2005 leveraged buyout, United's debt remains stubbornly high. But the numbers alone don't tell the full storythe club hasn't just carried debt, it's added to it in key years to finance poor decisions.
When Did United Borrow More?
Below are the years where new borrowings were drawn down, increasing the club's overall debt levels:
| Year | New Borrowings (£m) | Use of Proceeds |
|---|---|---|
| 2017 | ~£100m | Refinancing existing debt |
| 2023 | £200m | Transfer window funding (Casemiro, Antony, etc.) |
These injections weren't funded by retained earnings or operational surplus. Instead, they added to the debt pile, which has hovered near £650 million for the last two years.
As of 2024, gross debt is £650 million, nearly the same as a decade ago.
| Year | Gross Debt (£m) | Interest Expense (£m) |
|---|---|---|
| 2012 | 436.9 | 43.2 |
| 2013 | 389.2 | 40.8 |
| 2014 | 341.8 | 38.5 |
| 2015 | 411.0 | 41.9 |
| 2016 | 409.3 | 42.1 |
| 2017 | 503.2 | 48.7 |
| 2018 | 495.7 | 45.3 |
| 2019 | 511.2 | 44.9 |
| 2020 | 524.4 | 47.2 |
| 2021 | 530.5 | 43.5 |
| 2022 | 535.7 | 45.2 |
| 2023 | 650.0 | 50.6 |
| 2024 | 650.0 | 49.3 |
- Debt has been serviced, not reduced. Interest payments hover around £40-£60 million annually.
- Recent transfer spending has been funded in part through short-term borrowing, not cash reserves.
Translation: The club is running on a financial treadmill.
Would-be Solution: Ratcliffe's minority investment in 2023 brought hope of strategic reform, but long-term ownership issues persist.
4. Transfers and Amortization: Big Buys, Soft Sales, and Clever Accounting
Manchester United has spent over £1.6 billion in the transfer market since 2013. But understanding how these purchases affect the books is crucial.
How Transfer Fees Are Accounted For
When United buys a player, the transfer fee isn't expensed all at once. It's amortized over the length of the contract. For example:
If a player costs £70 million and signs a 4-year deal, the club records £17.5 million as an expense each year.
Chelsea has famously pushed this strategy to the limit signing players on 7- or 8-year deals to reduce annual amortization charges. This spreads the cost thinner, which helps comply with Financial Fair Play (FFP) rules. UEFA has since capped the amortization period to 5 years to curb this practice.
Case Study: The Financial Fallout of Fading Assets
Below is a comparative case study of players likely to be sold, each illustrating different accounting impacts based on transfer fee, contract length, amortization, and homegrown status.
| Player | Original Fee (£m) | Years Amortized | Book Value (£m) | Hypothetical Sale (£m) | P&L Impact |
|---|---|---|---|---|---|
| Casemiro | 60 | 2 (of 4) | 30 | 20 | -10 (Loss) |
| Antony | 85 | 2 (of 5) | 51 | 40 | -11 (Loss) |
| Marcus Rashford | 0 (Academy) | N/A | 0 | 80 | +80 (Profit) |
| Luke Shaw | 30 | Fully Amortized | 0 | 20 | +20 (Profit) |
| Andre Onana | 47 | 1 (of 5) | 37 | 30 | -7 (Loss) |
| Jadon Sancho | 73 | 3 (of 5) | 29 | 20 | -9 (Loss) |
Key Takeaways:
- Homegrown advantage: Players like Rashford generate pure profit on sale due to no amortized book value.
- Injured or aged assets: Luke Shaw's value is fully amortized, so any sale is pure gain, even if low.
- Poor ROI: High-fee signings like Antony and Casemiro pose losses due to unrecouped book value.
- FFP implications: Clubs must manage amortization intelligently. Chelsea tried long contracts, United may need smart exits.
Fan Takeaway: Every time a high-fee flop is sold at a loss, it's not just poor scouting, it's a direct hit to the club's ability to reinvest. Balancing footballing ambition with accounting savvy is no longer optional.
CFO Insight: Manage your assets with an eye on their book value. Large investments need to be paired with either performance or resale. If you overpay for talent, you may face tough choices: sell at a loss or keep paying wages for diminishing returns. A smart CFO will aim to minimize dead money on the books by aligning contract length with realistic value horizons and being willing to cut losses early if needed.
4A. Value Destruction and Missed Opportunities: A Broken Transfer Model
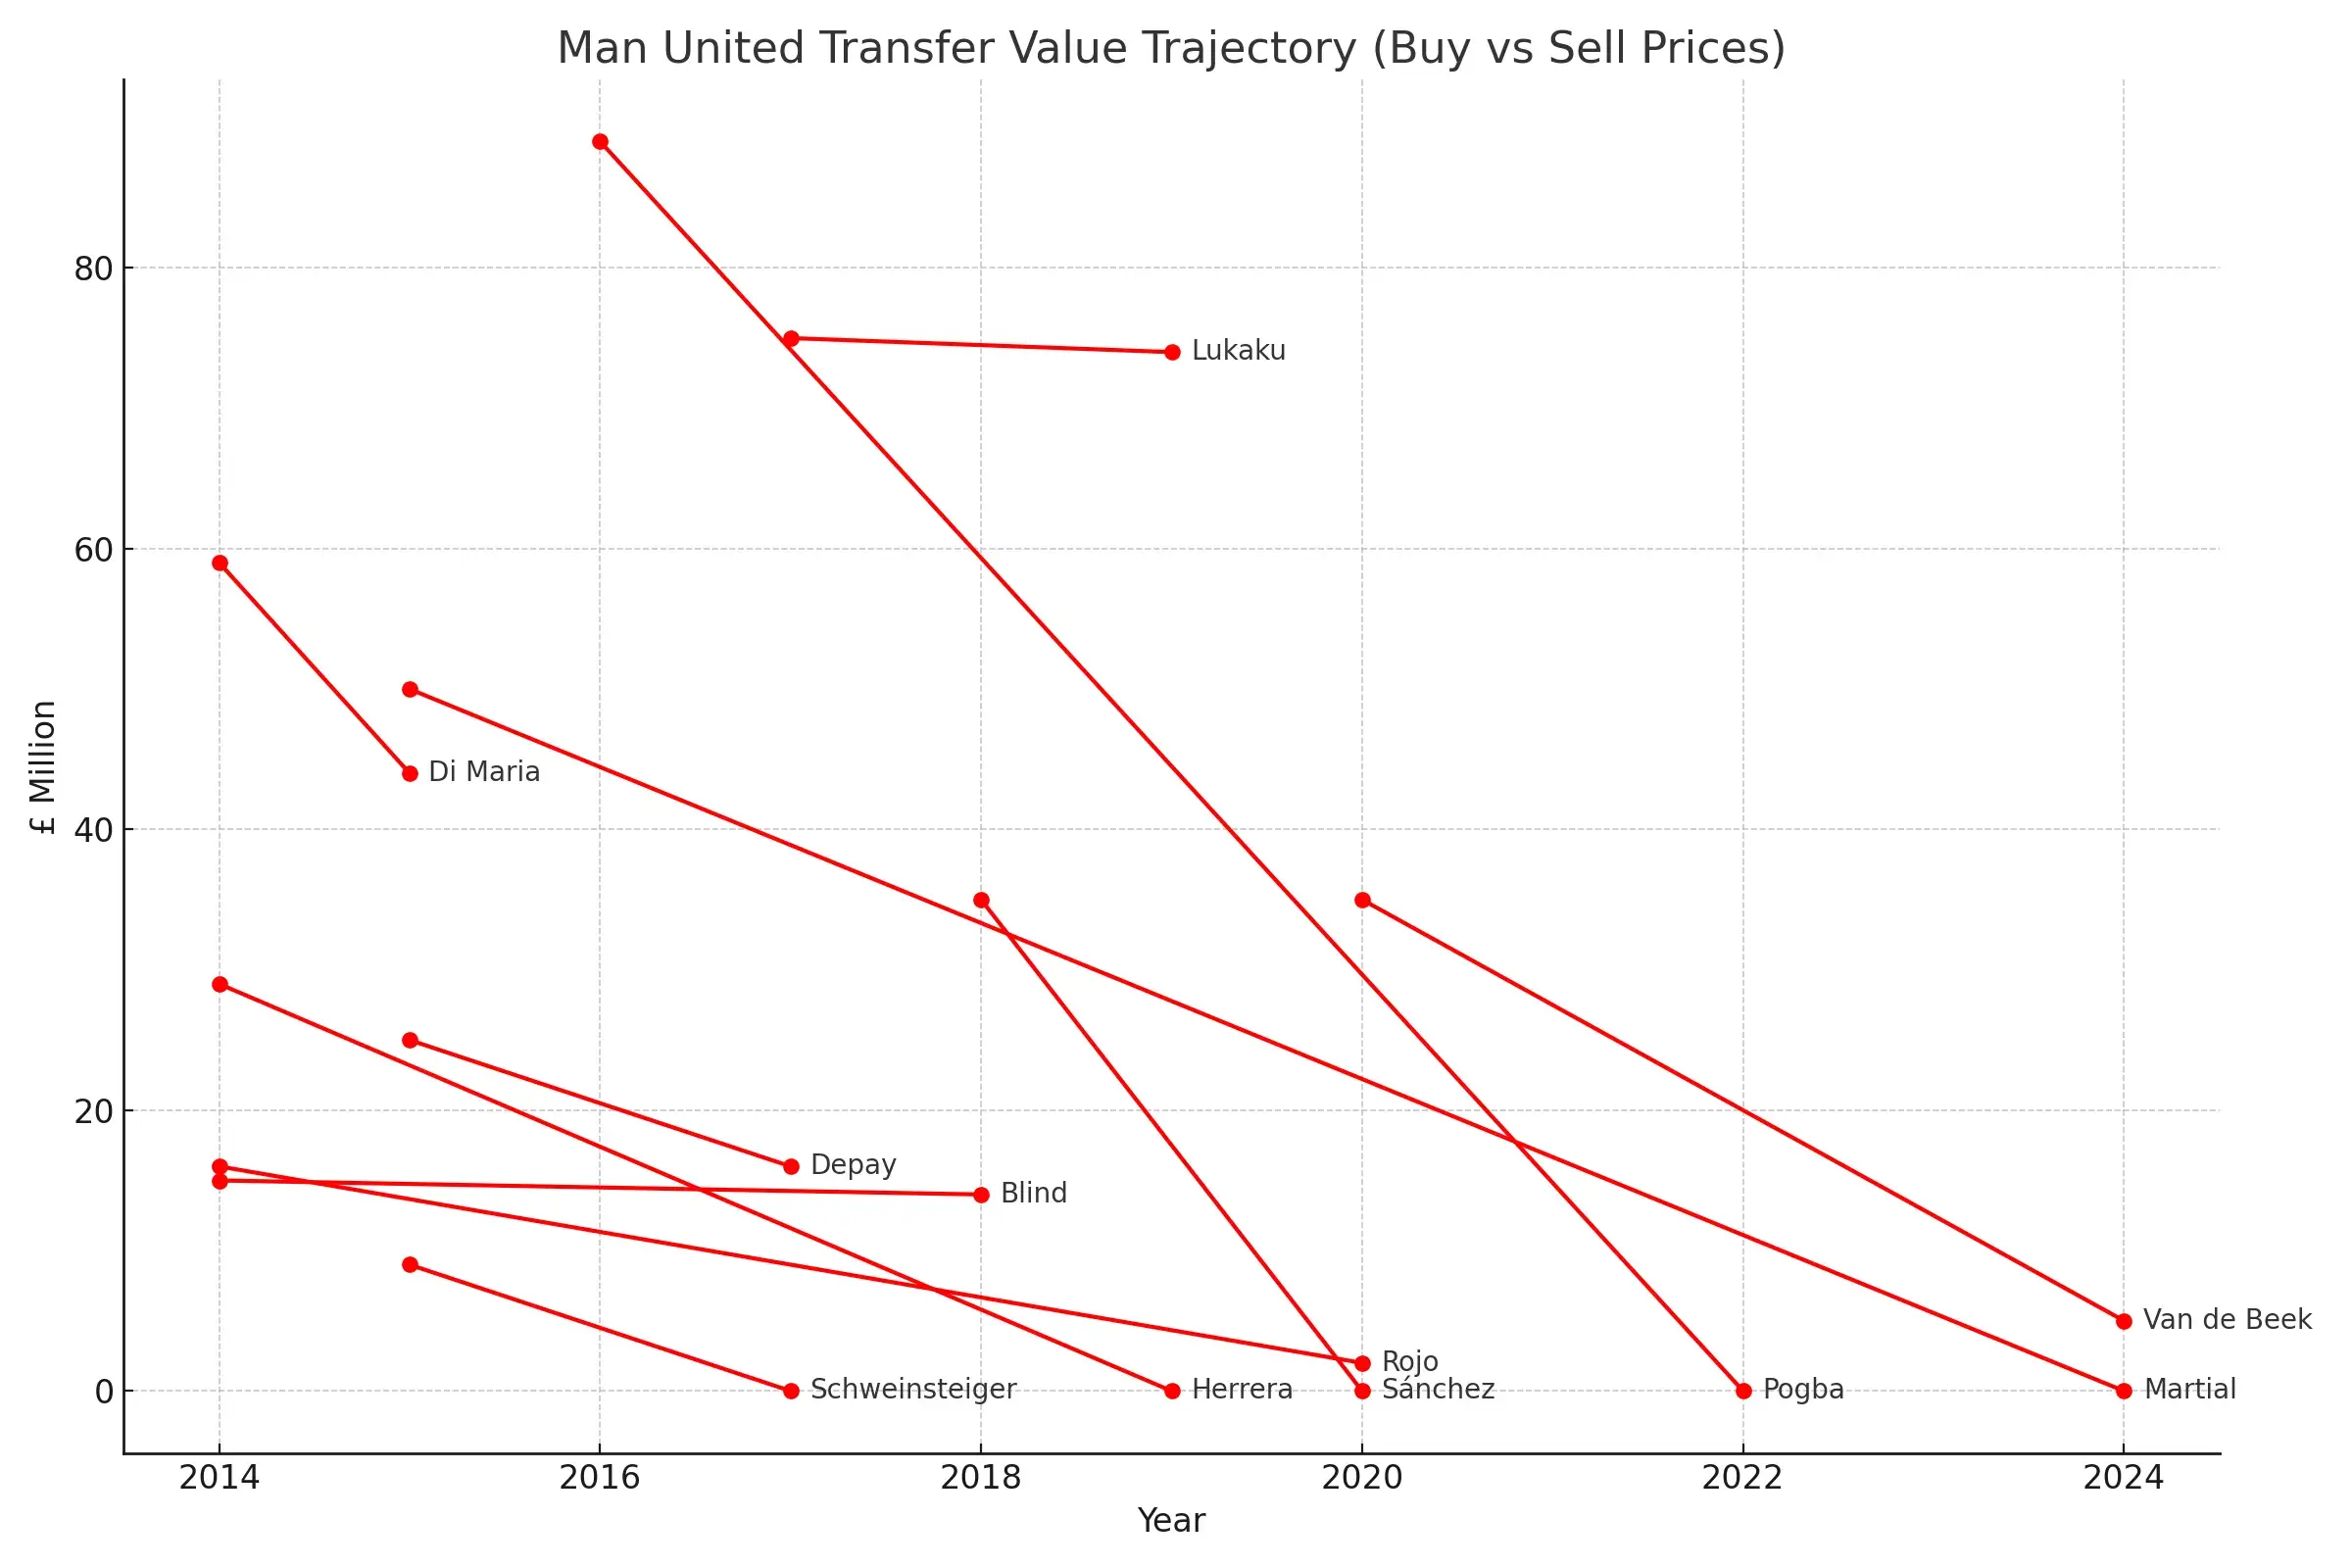
Another consequence of poor transfer strategy is the destruction of player value and missed opportunities to sell at the right time. Manchester United has frequently held onto players whose market worth was declining or let star players leave for free, foregoing substantial income. The club's net transfer spend over the past decade exceeds £1 billion, yet this huge investment hasn't translated into equivalent success or retained value. In fact, many expensive signings departed Old Trafford for a fraction of their purchase price or no fee at all:
- Allowing high-value players to leave for free: Paul Pogba returned in 2016 for a then-record £89m, only to depart for nothing in 2022 at the end of his contract. Similarly, club stalwarts like David de Gea and Nemanja Matic ran down their deals and exited without generating any transfer revenue.
- Selling low after buying high: Several big-money signings were sold at steep discounts. Angel Di Maria (£59m purchase) was sold after one season for around £44m. More recently, Jadon Sancho's £73m transfer could end in a sale for a fraction of that fee, highlighting a trend of buying at peak price and selling at trough value.
- Lack of a sell-on strategy: Unlike some rival clubs, United rarely capitalized on fringe or youth players for profit. Talents like Jesse Lingard and Ander Herrera left without fees, and opportunities to sell players like Anthony Martial or Phil Jones when their value was higher were missed, resulting in lost potential income.
The combination of these missteps has led to a poor return on investment. Money spent on incoming transfers largely stays sunk, while the squad's market value erodes. Essentially, United have not recycled value back into the club. For a business, this is akin to heavy capital expenditures with minimal salvage value, a recipe for a high depreciation charge with little to show for it.
CFO Insight: Every asset has a lifecycle. In football or business, know when to divest. A proactive selling strategy can maximize returns before assets depreciate completely. For United, adopting a more disciplined sell-high approach (even with fan-favorite players) could have generated funds to reinvest in fresh talent. CFOs should foster a culture where exiting an investment at the right time is as important as the decision to acquire it.
4B. Managerial Sackings: The Hidden Price of Failure
Perhaps nothing underscores Manchester United's turbulent decade more than the revolving door in the manager's office. Five permanent managers have been hired and ultimately dismissed since 2013, each tasked with restoring United to the summit, only to be shown the exit when results fell short. From David Moyes, handpicked as the 'Chosen One' to succeed Ferguson (but gone in under a year), to proven winners like Louis van Gaal and Jose Mourinho, to club legend Ole Gunnar Solskjaer, and most recently Erik ten Hag, the club repeatedly turned to new leadership in hope of a turnaround.
This instability has come at a steep price. United have spent around £75 million in combined compensation payouts to these managers and their staffs after terminating their contracts. The table below breaks down the reported severance figures for key managerial changes:
| Manager | Year of Sacking | Reported Payout |
|---|---|---|
| David Moyes | 2014 | £5.2 million |
| Louis van Gaal | 2016 | £8.4 million |
| Jose Mourinho | 2018 | £19.6 million |
| Ole Gunnar Solskjaer | 2021 | £10 million |
| Erik ten Hag | 2024 | £14.5 million |
| Total | £57.7 million |
Beyond the financial cost, this managerial churn exacted a sporting cost as well. Each new regime meant new players, new systems, and often writing off expensive signings made by predecessors. The irony is that a club famed for stability under Ferguson became one of the most volatile at the top, paying a premium for its lack of patience. Sack, spend, repeat became an all-too-familiar cycle at Old Trafford.
Fan Insight: For a club that often preaches stability, United's coaching carousel has quietly become a multi-million-pound liability. And worse, these aren't even investments, they're sunk costs triggered by failure.
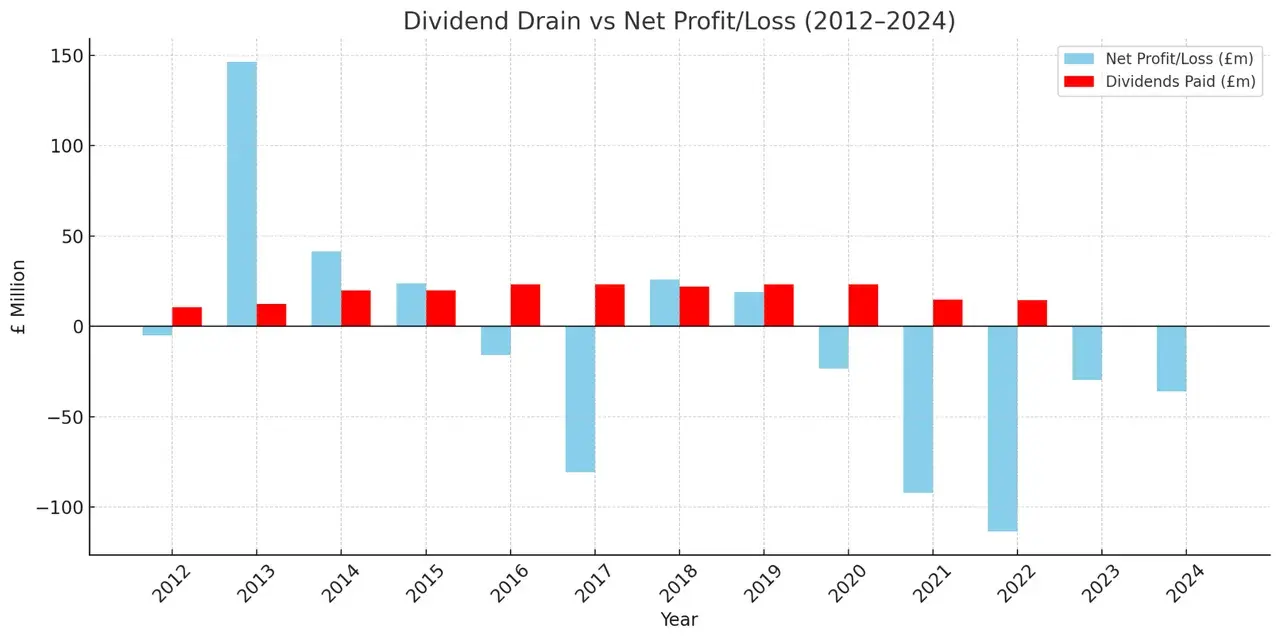
5. Dividends: The only Club Paying Out While Losing
Amid all the outlays on transfers, wages, and managers, Manchester United has also been sending a significant stream of money out of the club in the form of shareholder dividends. Since 2016, United's owners (the Glazer family) have drawn cash dividends almost every year, a rarity among football clubs, as United stands virtually alone in the Premier League for paying regular dividends to shareholders. Over the past decade, those dividend payments have totaled over £150 million.
These payouts have been controversial to say the least. Supporters argue that money should be reinvested into the squad or infrastructure, especially when the team on the pitch is struggling. The optics of the owners profiting while the club racks up debt and middling results have fueled fan protests and the green-and-gold anti-Glazer movement. The club even skipped a dividend in late 2022 amid mounting criticism and the potential sale of the club, an acknowledgment of how contentious the issue had become.
Dividends vs Net Profit/Loss (2012-2024)
| Year | Dividends Paid (USD) | Net Profit/Loss (£m) |
|---|---|---|
| 2012 | $10.6 million | -5.0 |
| 2013 | $12.3 million | 146.4 |
| 2014 | $20.0 million | 41.5 |
| 2015 | $20.0 million | 23.8 |
| 2016 | $23.2 million | -15.9 |
| 2017 | $23.2 million | -80.8 |
| 2018 | $22.0 million | 25.8 |
| 2019 | $23.2 million | 18.9 |
| 2020 | $23.2 million | -23.2 |
| 2021 | $14.7 million | -92.2 |
| 2022 | $14.6 million | -113.5 |
| 2023 | None (suspended) | -29.5 |
| 2024 | None | -36.0 |
Analysis:
- From 2012 to 2022, over $230 million was paid out in dividends, even though the club reported losses in 7 of those 11 years.
- 2022 was the worst: the club posted a £113.5 million loss and still paid out $14.6 million in dividends.
- Dividends were suspended only in 2023 and 2024 amid pressure from fans, shrinking profits, and on-pitch failure.
All this while the club:
- Carried over £600 million in debt
- Missed Champions League qualification multiple times
In plain English: Imagine giving yourself a bonus while your business is bleeding money.
Fan Response: Justified outrage. It led to large-scale protests and intensified scrutiny of the Glazer ownership.
Dividend payments, coupled with the interest on the debt, mean that a substantial amount of United's revenue has flowed out to owners and lenders rather than back into football operations. In a decade where the team has fallen from perennial title contenders to merely top-four hopefuls, this financial reality remains a sore point. It raises a fundamental question: what might Manchester United have achieved if those funds had been available for footballing purposes?
6. Cash Flow Health: Making Money, But Not Keeping It
Despite strong revenue, United struggles to hold onto cash. Here's a simplified version of their cash flow picture:
- Operations: Healthy inflow (~£140m in 2024)
- Investing: Huge outflows (~£200m+ annually), mostly for transfers
- Financing: Involves borrowing and (formerly) dividend payments
Key Concern: Free cash flow is often negative. The club lives paycheque to paycheque and borrows to cover gaps.
Example: In 2023, United borrowed £200m to fund summer transfers.
In Real Life Terms: This is like earning a six-figure salary, spending even more, and putting the rest on a credit card. Eventually, you hit the limit.
Final Whistle: Time for a New Gameplan
Over the past 10 years, Manchester United has brought in billions and spent even more. The brand is as strong as ever. The global fanbase, Still loyal. But the financial engine has misfired:
- Bloated wage bills
- Wild transfer inefficiencies
- Payouts to owners amid debt and losses
The Theatre of Dreams needs more than a manager swap. It needs a reset in philosophy, one where smart financial management finally complements the club's massive footballing ambition.
Fans have done their part. The numbers prove it.
Now it's time the board does theirs.
Data Source: All financial information referenced in this article has been extracted from Manchester United PLC's official SEC filings, primarily Form 20-F submissions and quarterly earnings releases.
Disclaimer: The Accuracy of Information and Investment Opinion
The content provided on this page by the publisher is not guaranteed to be accurate or comprehensive. All opinions and statements expressed herein are solely those of the author.
Publisher's Role and Limitations
FinClarity serves as a publisher of financial information and does not function as an investment advisor. Personalized or tailored investment advice is not offered. The information presented on this website does not cater to individual recipient needs.
Liability Disclaimer
Neither the publisher nor its affiliates assume liability for any direct or consequential losses arising directly or indirectly from the use of the information provided in this content.
No Offer or Solicitation
The content, including opinions and expressions, present on this website, is not a direct or indirect offer or solicitation to buy or sell securities or financial instruments mentioned.