Excel vs Power BI for Small Businesses: From Chaos to Clarity
April 13, 2025
Let’s be real: Excel is the MVP for many finance teams.
It's familiar. It's powerful. And when you're running the numbers for a new product launch or mapping out quarterly forecasts, nothing beats a formula-driven spreadsheet with direct cell manipulation.
But as your business grows, so does the complexity of your data. You may start asking:
- “How do I handle data from multiple systems?”
- “How can I make my reports interactive?”
- “Why does this Excel file take forever to open?”
Enter: Power BI—a powerhouse built for scalability, visualization, and collaboration.
Excel: Your Go-To for Tactical, Precision-Driven Analysis
If you’re juggling ad-hoc financial models, working with relatively moderate data volumes, or whipping up quick what-if analyses, Excel is still king. Here’s why:
- Control & Flexibility: You can build formulas from scratch, tweak them live, and adjust inputs on the fly.
- Financial Modeling: Excel remains the gold standard for building out detailed income statements, cash flow projections, and budgeting templates.
- Fast Reporting: Need to pull together a one-off report for your board? Excel does the job without needing a dashboard overhaul.
Example: A boutique marketing agency may use Excel to build a profitability tracker by client. With built-in formulas and pivot tables, they can analyze which projects drive the most margin—and update it every month without a hitch.
Power BI: When You’re Ready to See the Bigger Picture
As your SMB starts gathering data from multiple systems (e.g., QuickBooks, a CRM, web analytics), you need something more dynamic. Power BI excels at:
- Handling Large Datasets: Think thousands (or millions) of transactions across months or years.
- Creating Live Dashboards: Sync data in real-time from accounting software, sales platforms, and inventory systems.
- Organization-Wide Insights: Let your sales team see their performance dashboards while finance reviews cash flow trends—all in one platform.
Example: A growing eCommerce business may use Power BI to connect sales, returns, and shipping data into one interactive dashboard. With drill-through capabilities, leadership can explore patterns by region, time period, or product line, making strategic decisions with confidence.
So… Excel or Power BI?
There’s no winner—just the right tool for the right job. Here’s the cheat sheet:
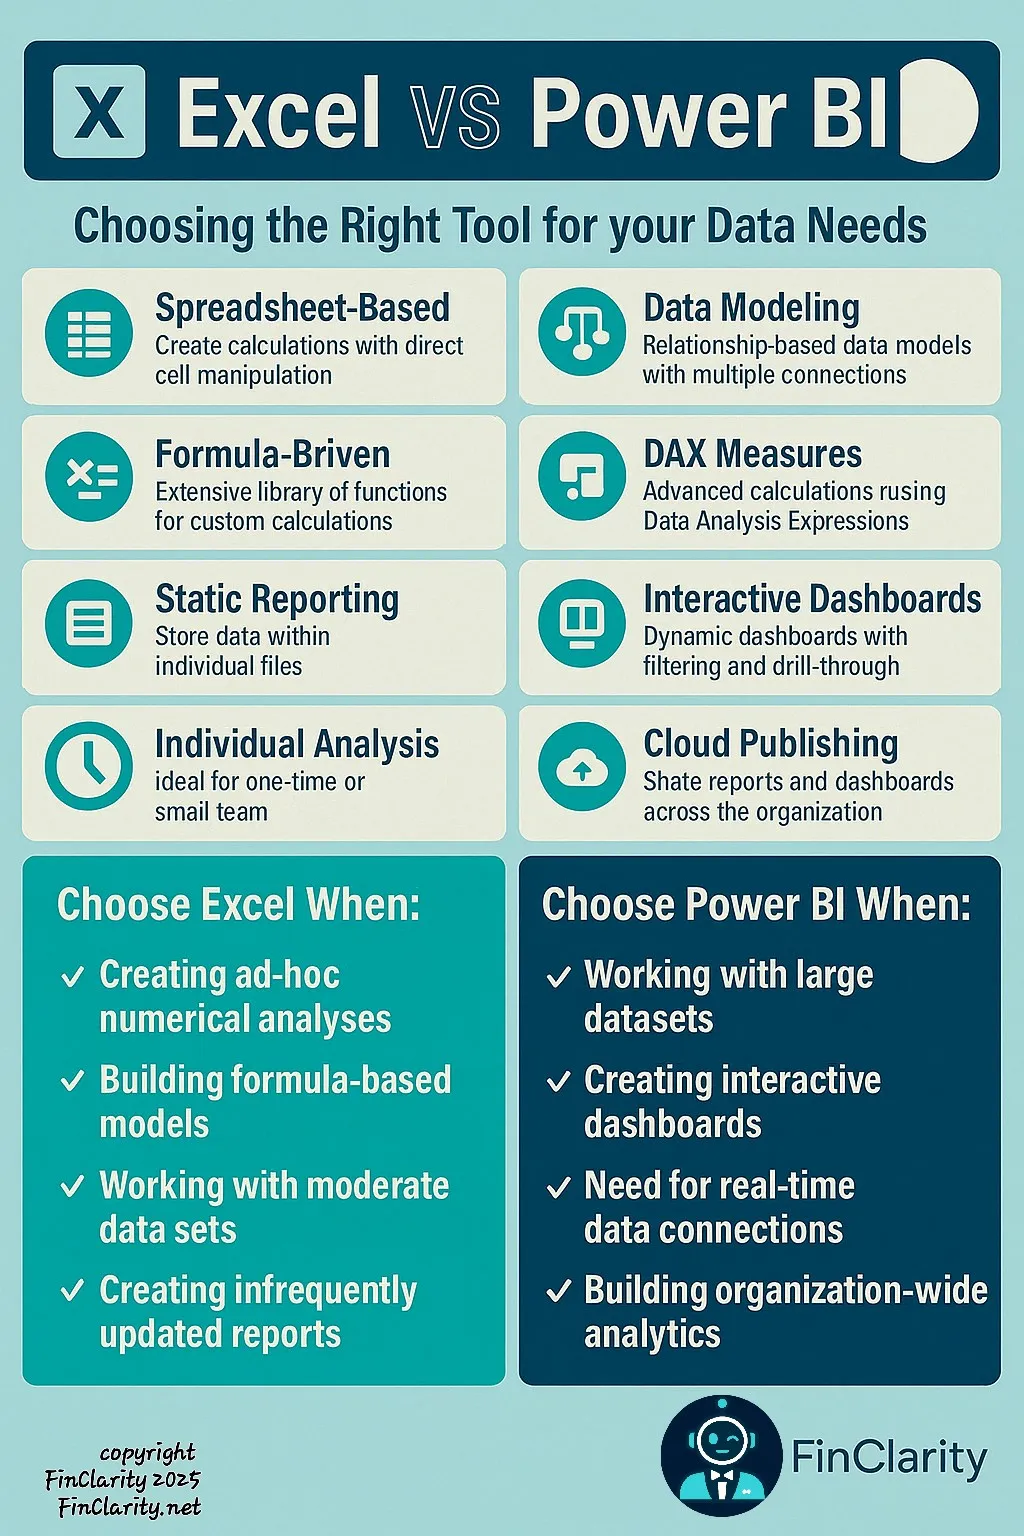
Choose Excel when:
- You need fast, ad-hoc number crunching.
- Your reports are updated occasionally.
- You're building out detailed, formula-heavy models.
- Data sets are small to medium in size.
Choose Power BI when:
- You’re working with lots of data from different sources.
- You want real-time dashboards with interactivity.
- You're scaling and need organization-wide reporting.
- You want your insights shared—not siloed.
The Final Word: Think Like an Architect
Don’t ditch Excel—but don’t ignore Power BI either. In many cases, they work beautifully together. Excel is your drafting table, and Power BI is your showroom. Use Excel to build the foundation, run calculations, and test ideas. Then move to Power BI to visualize, interact, and share those insights in a way that drives real business action.
SMBs that learn to bridge both worlds won’t just report on the past—they’ll predict the future.
Need help integrating Power BI with your existing accounting setup? Or want to optimize your Excel models for faster insights? Reach out to our team at FinClarity. We help SMBs turn financial data into business clarity.